Model Talk: Q&A with Harry Enten
Over the last few months, I have had the opportunity to work with Harry Enten at CNN (formerly Fivethirtyeight) to create “The Forecast” — CNN’s 2018 midterm election model. It has been an awesome experience, and I intend to write a longer reflection after the elections. For now, I would like to share some of the finer details about the model that we created, since I know that there are some people out there who, like me, weren’t completely satisfied with the original methodology page that went along with the model. So here is a Q&A session that Harry and I had to take a deeper look at some of these details. If you have any other questions, feel free to email or send a tweet!
Harry: Let’s start off with what all districts have… The fundamentals… What are we looking at there?
Parker: We don’t usually have all of the rich information on Congressional districts like we have for states in elections for the Senate or President. But here are some key indicators we can gather from every district to form an initial forecast, which we call the “fundamentals”:
Candidate characteristics – the share of money each candidate has raised from individual donors and in total, a measure of the incumbent candidate’s ideology, whether a candidate is involved in a scandal, and whether the incumbent is a freshman in congress.
District information – whether the district has an incumbent candidate running (and if so, which party they belong to) or if the seat is open, whether the district lines have been re-drawn since the last election, previous election results and the swing from the last two elections, and a measure of the district’s partisan lean (how the district has voted in past federal, state, and local elections).
National environment – whether the election is during a midterm year or on-cycle year (and the party of the sitting President if it is a midterm), and the generic ballot polling average (see below for details).
These indicators are great, but they don’t capture a lot of the nuances that are specific to this year’s election. To address this weakness, we include ratings from political experts that use their knowledge and detailed research to assess the likelihood that each candidate wins in every district. These handicappers have an excellent track record of grading races.
We use all of these inputs (variables) in the random forest model to forecast a vote share for each candidate (a point estimate). A random forest is a tree-based machine learning algorithm that constructs and aggregating the results from many decision trees, each with a random selection of input variables and training data. There are many benefits to a random forest that make it appropriate for election forecasting. First, it is designed to reduce the chance that we over-fit our model by combining the predictions of hundreds of trees. Tree-based methods also have the advantage of being able to handle different data types, find the ones that are most important and ignore the others, and make predictions when there is a lot of interaction and correlation among predictor variables. The random forest is also highly accurate – the average out-of-sample error for individual districts in less than 3 points, and it calls more than 97% of races correctly!
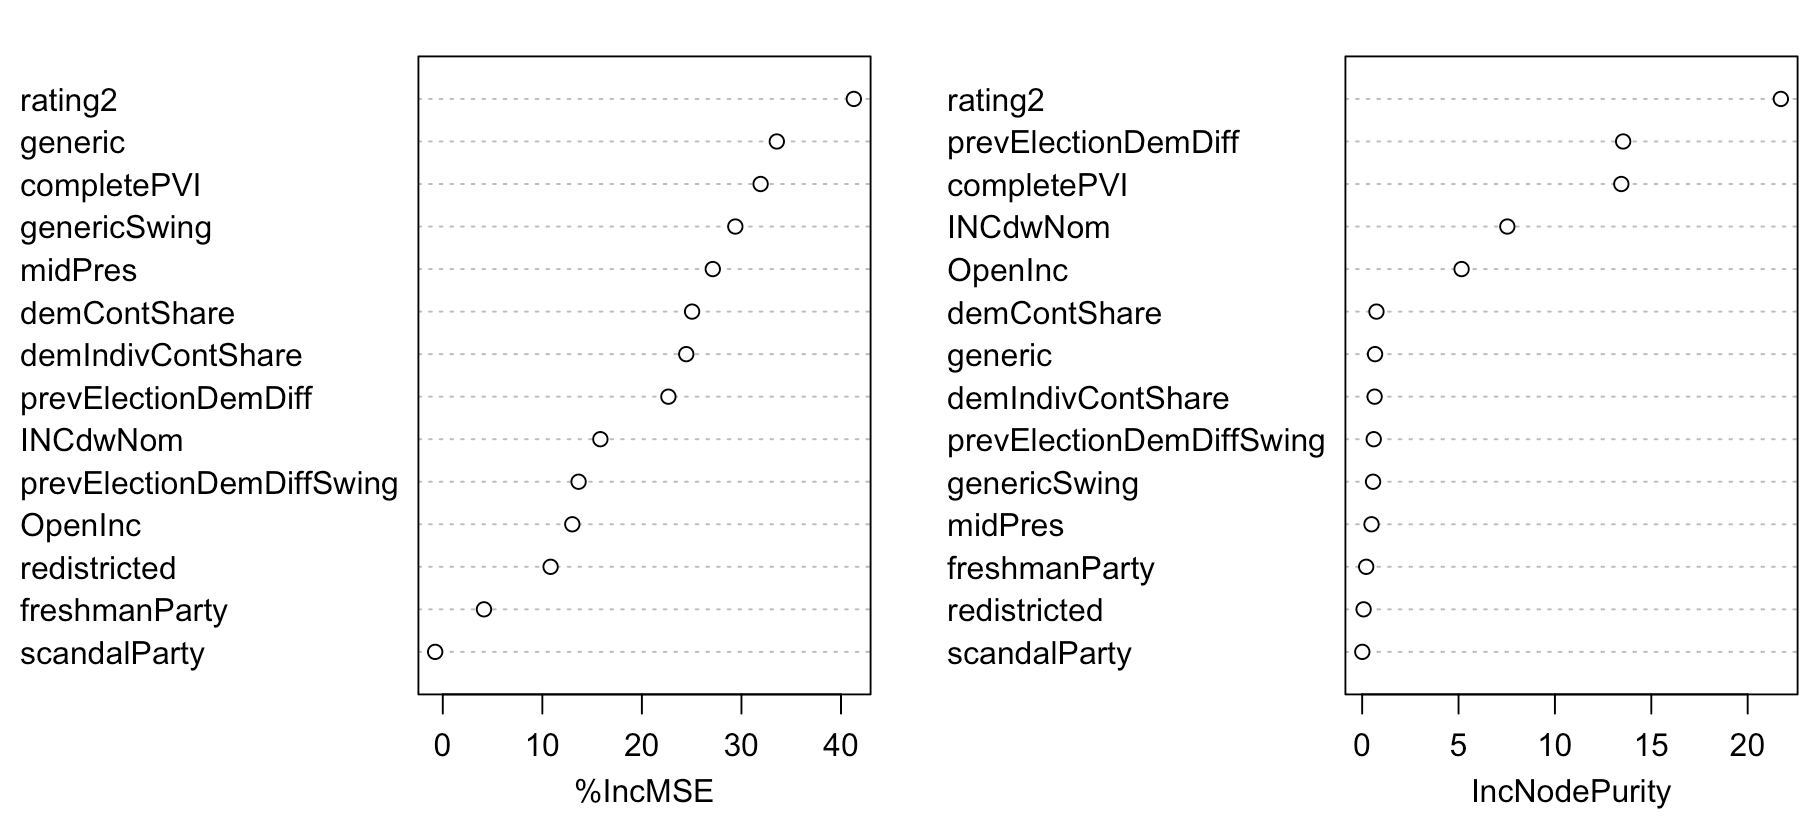
Random forests also give us information about which input variables are the most important – the chart below shows how much each variable contributes to reducing the error in the model. We see that the expert ratings, district partisanship, and several national and candidate-specific characteristics contribute the most to model accuracy. More information on how to interpret this chart can be found here.
Harry: The districts that have polling are something different… How are you calculating the averages?
Parker: District polling is sparse and not as reliable as national or statewide polling, which makes things challenging. Luckily, we have a few tricks up our sleeve. There are a lot of factors that go into the district polling average, but it essentially comes down to age and methodological quality.
In general, the older an individual poll, the less influence it has on the weighted average for that district, and older polls are adjusted according to shifts in the national environment (via the generic ballot average). Individual polls are also weighted based on their methodology — for example, polls with more respondents are given more weight in the district average.
Adjusting for pollster quality is also very important. Pollsters for House elections can vary in their historical accuracy, and many are partisan organizations. Before they are aggregated, district polls are adjusted based on the pollster’s historical accuracy and partisan bias.
Harry: How are we combining the district polling and the fundamentals?
Parker: For districts that have been polled, the polling average is combined with the random forest prediction. The amount of weight that the polling average gets depends on the number of polls that have been conducted in the district, how recently it has been polled, the number of respondents that make up the average, and, importantly, how close we are to election day. As we approach November 6th, district polls will get more weight in the final predictions (all else equal).
Harry: How is the generic ballot involved in all of this?
Parker: The generic ballot polls (which are averaged in a process that is similar to the district polling averages), are an important part of the entire process because they measure the national political environment, so they are involved in just about every stage of the model. The national generic ballot average is used to adjust old district polls, and is one of the inputs to the random forest model. We also use the generic average in the simulation, where we imagine a range of differences between the current average and the final national vote share for each party, and see how that affects the results.
Harry: How are we summing up to a seat count?
Parker: The very specific point predictions that we get from the random forest model are great, but they aren’t perfect. Things can change between now and election day, and we don’t have perfect information for each district or the nation as a whole. To make up for this, we run thousands of simulations of these results, making small changes to the inputs each time, to get a range of outcomes (more details on these “small changes”, which we call errors, below). This method is known a Markov Chain Monte Carlo simulation. Every time we run a simulation, we keep track of which candidate won each district, and what their final vote share was. Using this information, we can get a margin for possible outcomes in each district and the nationwide seat count.
Harry: Why will summing up who is winning in individual districts not necessarily equal the total nationwide?
Parker: Because our predictions are probabilistic, the individual district forecasts can differ in number from the most likely scenario in the simulation.
It’s easier to see this in the Senate, where the same principle applies — we currently expect Democrats to secure 48 seats, even though they are favored in enough races to secure 49. Democrats are defending a lot of seats, and it’s more likely that they lose in some states where they are slight favorites than win all of the close races (let alone upset enough Republicans to secure a majority). In baseball terms, the Republicans are up 3-0 in the series, and although Democrats are favored in games 4, 5, 6, and 7, we don’t expect them to win the series.
Harry: Can we talk about potential sources of error? Like why are the error estimates so wide? Might they be too wide?
The simulation is a tool we use to capture the uncertainty of the point predictions produced by the random forest. There are several sources of uncertainty, and when we consider that there are hundreds of districts and that outcomes can be correlated, we end up with a large margin of error.
The sources of uncertainty can be divided into a few groups, but it’s important to remember where this uncertainty comes from. First, it is possible that several of these inputs change between now and election day, so error will generally decrease as we approach the election. Second, many of these measures are imperfect, so we want to account for error our inputs.
The simulation considers the following sources of error:
National error – the national vote share may uniformly favor one party over the other, causing the polls and district predictions to be systematically off in one direction. To account for this, the simulation chooses random shifts in the generic average and the distribution of district error.
District error – the simulation also randomly assigns an error for each district, which is correlated with the national error. The distribution of this error term is informed by the range we have observed in past House elections, and also affects the polling average for districts that have been polled.
Incumbency error – In past elections, we have seen that there can be a small advantage or disadvantage to all incumbents, regardless of party. Our model tries to account for this possibility.
From all of these error terms, we predict a wide range of possibilities in individual districts and nationwide. We think that the margins are appropriate to the amount of uncertainty inherent to the model based on historical outcomes. Remember, the margins are 95% intervals (as in, we expect 19 in 20 of the final outcomes to fall inside the range), and for districts with more information, the margins are generally smaller. We wish we could predict one outcome for each district and overall, but forecasting is difficult, and we want to communicate the range of possible outcomes based on the information we have. Anyone who gives you a forecast without this uncertainty is being disingenuous, and will be wrong much more often than they are right.