Election 2018 Battlegrounds …another Q&A with Harry Enten
Election Day is approaching! It is always interesting to look at the trends leading up to an election, like which demographics or geographic areas seem to be the most important. So, with just a few days left in this election cycle, let’s take some guesses about what we will be talking about post-election. This is an extension of the Q&A published by CNN on 30 October.
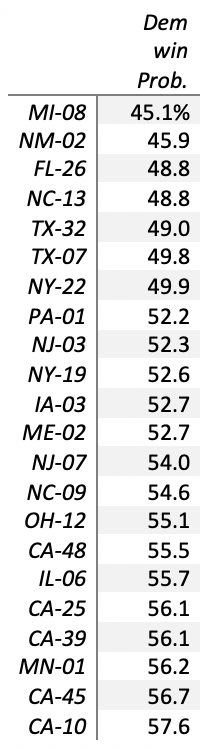
As of this writing, our model has 22 toss-up districts, where both candidates have between a 40 and 60 percent chance of winning. They are:
Harry: Geographically where are we seeing the 20 closest races in the House?
Parker: These districts are distributed very evenly across the country – six of them are in the northeast, five in the Midwest, five in the South, and six in the West – suggesting that the battle for the house isn’t confined to a certain part of the country. Instead, we might find that many of the decisive contests are held in districts that are geographically separated but otherwise very similar.
That said, these toss-up districts could change and reveal a new trend. For example, the next 20 most competitive districts (where the favored party has between a 60 and 75 percent chance of winning), we see only two western districts, and zero northeastern districts! With two weeks left, and new polls coming out every day, we could find that some of these districts become more competitive, and suddenly the battle for the house is concentrated in the Midwest and South. This is why it is important to check our forecast every day!
Harry: Do they tend to be in areas that are more or less rural than the national average?
Parker: Let’s be clear: this is a fight for the suburbs. Toss-up districts are about twice as likely to be sparsely suburban or an urban-suburban mix than the rest of the country. Only two of these districts are completely urban or completely rural, compared to about a quarter of all other districts. Unlike the geographic trends, this is not likely to change significantly – races that lean towards one party (but may become toss-ups by November) are even more likely to be in sparse suburban districts.
Harry: Are they well educated districts? (I have given you this file in the past, but happy to send over.)
Parker: 13 of the 22 toss-up districts have higher than average rates of college degree attainment, and overall about 35% of adults in these districts have degrees, compared to 29.7% for the rest of the country. The rates for “Lean D” or “Lean R” districts are nearly the same, so it seems that the tightest races this November will end up being about 20% more educated than the country overall.
Case study
Comparing two toss-up districts – Illinois 6 and New Jersey 7 – is a great way to understand the national trends. Both cover the suburban portions of major metropolitan areas (Chicago and New York) and are low or medium in population density. These districts are about 80% white and among the most educated and wealthy districts in the country – both have median incomes of around $100,000 and 50% of the population are college educated. That said, they are slightly different types of suburbs and are in completely different regions of the country.
Harry: If you took out the district polling from the model, where would things stand?
Parker: Removing the polls from our model means relying more heavily on the fundamentals and expert ratings. Luckily, the fundamentals are already fairly predictive themselves, and the experts usually take into account polls when rating districts. So, predictably, taking the polls out does not have a huge effect on the “top line” results — the number of seats we expect each party to win and how likely they are to control the house. Overall, the model would predict six additional seats for the Democrats (and modestly increase the likelihood that Democrats take the house). These six districts are tightly contested but have polling averages that are just below 50% for the Democratic candidate (IL12, ME2, MI8, MN8, NM2, and WA8), and would still be considered toss-ups in a model that ignores district polling.
The effect of removing polls is more obvious at the district level, where polling often captures the characteristics of this particular election better than the fundamentals. For example, in Texas 23, our model without polling data would show something close to a toss-up race, with Democrat Gina Ortiz Jones getting about 49.8% of the two-way vote. This is because Texas 23 is cross-pressured — it has a Republican incumbent but leans to the left in terms of its weighted partisanship indicator. However, the polls that have come out tell a different story — with a polling average of only 42% for Jones, we think that this will be a fairly safe Republican hold (for now).
Harry: We haven’t been presenting probabilities… but what are the odds for a Dem takeover? And are there any seats where Dems have a less than 50% chance of winning, but our point estimate has them winning?
Parker: Our model produces both top line and district-level probabilities, but we prefer to focus on margins since those are a little more intuitive. If presented as a probability, our top line results would show Democrats at about 3-in-4 favorites to take the House (specifically, about 73% probability, as of 19 October). This leaves plenty of room for Republicans to hold the House, as our current top line margin of error suggests.
At the district level, we spotted an interesting (though relatively rare) possibility — a handful of districts predict a Democratic vote share over 50%, but a probability below 50%. How is that possible? First of all, this only occurs in districts that are near perfect 50/50 toss-ups to begin with, and we only simulate these elections so many times in our model. Second, this tends to indicate that a district’s final predicted vote share is somewhat higher than the polling average, which contributes to skewed distributions around the prediction. Capturing the skew in these districts is great, but leaves the model open to the occasional odd result. In the end, we would still consider these districts a virtual coin flip.