How we did, and other Midterm 2018 reflections
It has been over a month since the 2018 midterm elections, and even though the final seat tally in the House is still undecided (thanks to possible election fraud in North Carolina district 9), it seems appropriate to reflect on the model I built for CNN, including successes, mistakes, and lessons learned.
The Model
To refresh on the details of how the model works, I recommend going to my model talk blog post, the methodology tab of my web app, or looking at the code for my web app on Github. These diagrams show the process we used to develop the model, with the goal of producing district-level and probabilistic predictions.
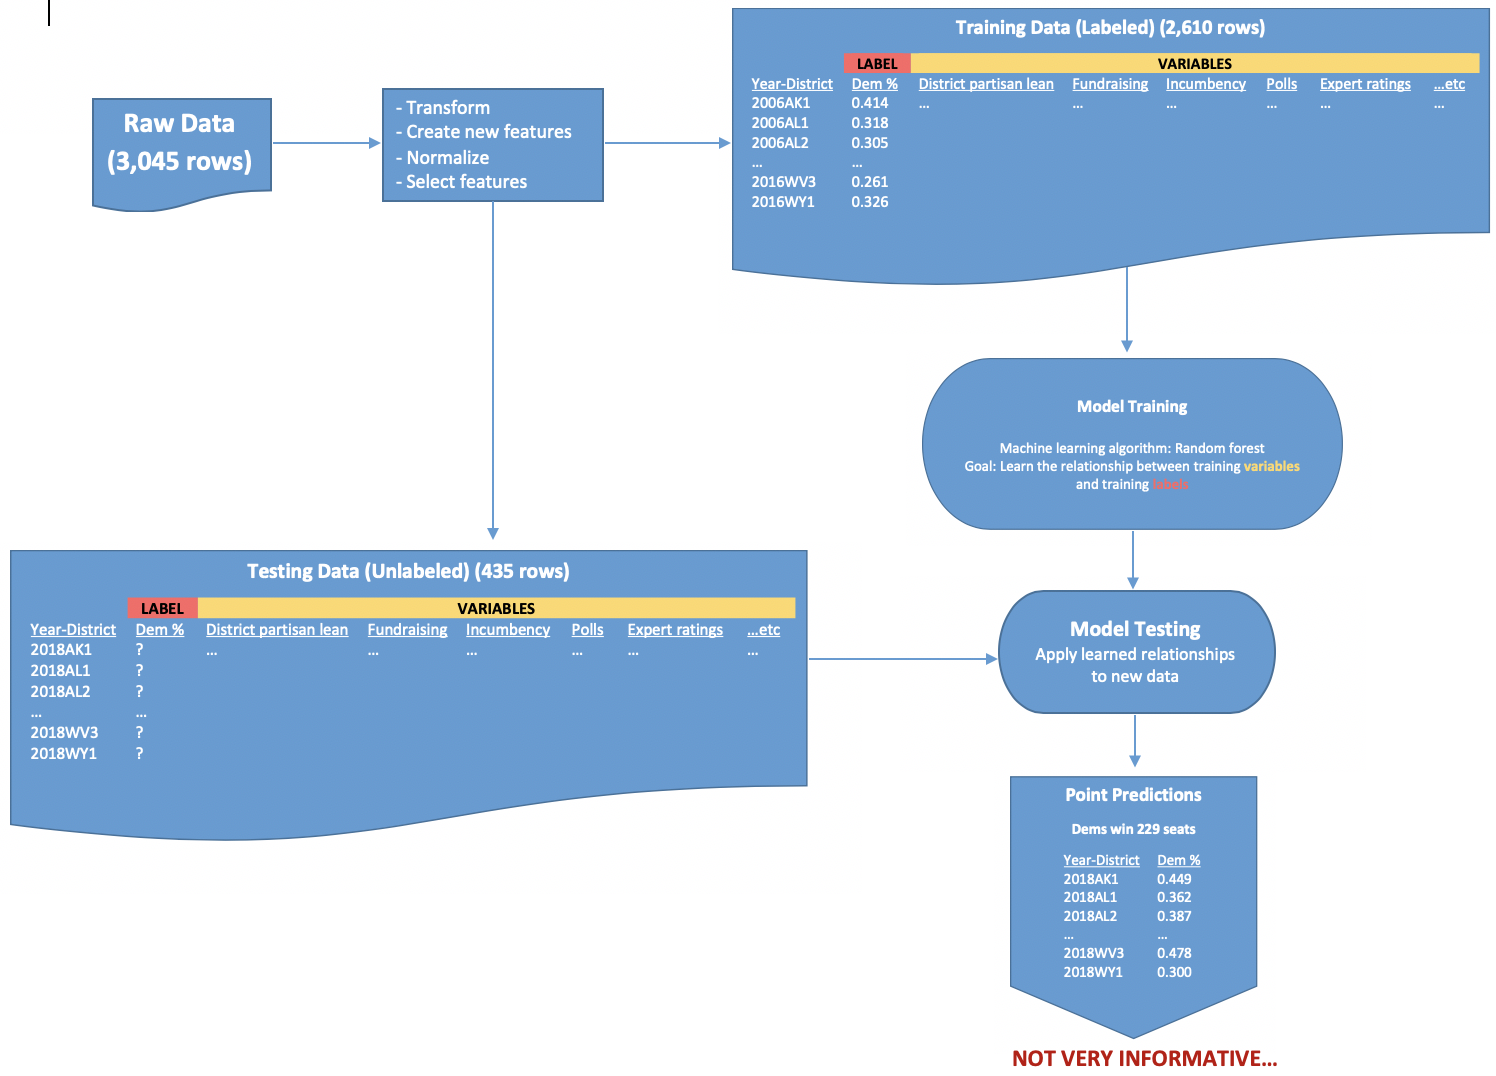
We start with some raw data, and after making some transformations and new features, we split the data into a training set (which is used to build the model, a random forest) and the testing set (which is fed to the trained model to produce predictions). The output is a set of vote share estimates for each district, which is great! But these don’t exactly capture the uncertainty of each election, so we keep going…
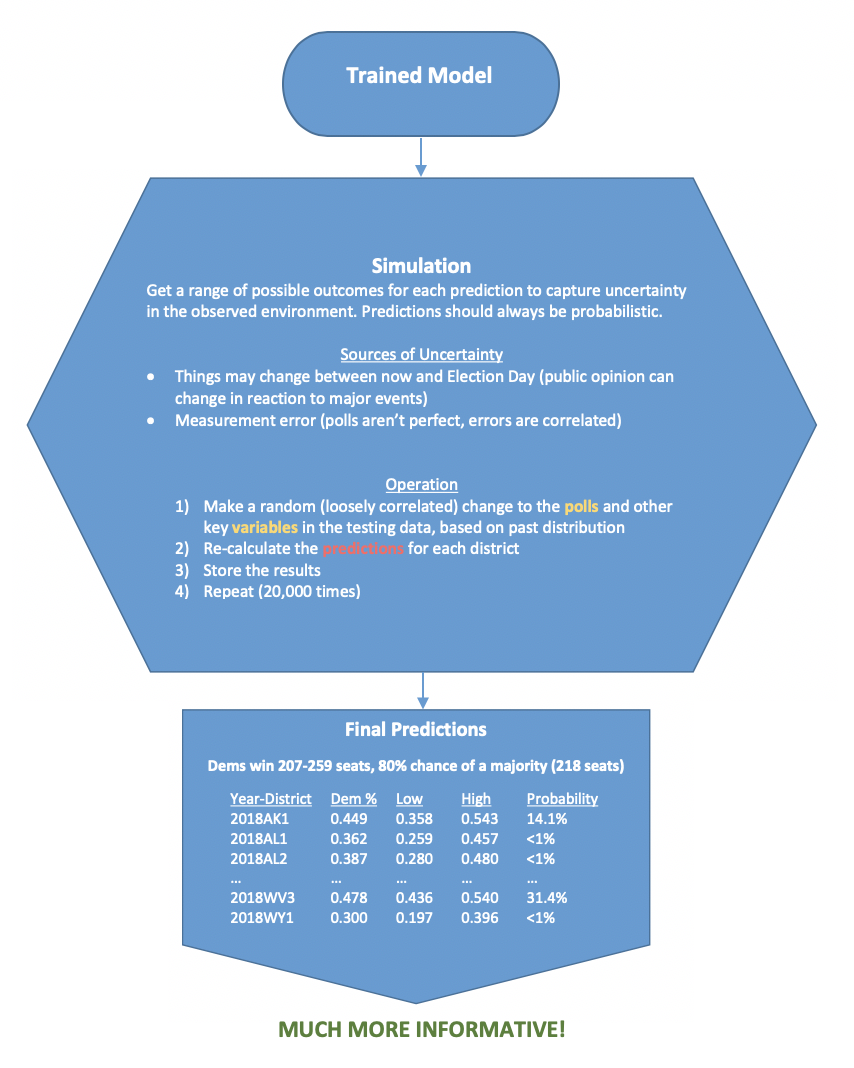
Now we’ve got something! For each district, we have a predicted vote share that we deem “most likely”, but then express the uncertainty of this outcome with bounds and an associated probability of victory for the Democrat. Then we can roll these up into a national forecast that shows the range of possibilities in the overall seat totals.
People hate uncertainty. They would rather we say, “Here is how many seats this party will win overall, and here are the districts they will win…” then decide if we were “right” or “wrong”. A more truthful forecast captures uncertainty and assigns a degree of confidence to each possible outcome. Forecasters who claim to be more confident than this or only provide a single predicted outcome are misleading you and will be wrong more often than they are right.
Yeah…that’s great. But how accurate was it?
Keep in mind that there is still one race to be called, but here I will describe the results as they stand right now. There are many ways to judge the accuracy of these models…
Look at the overall “top line” result (which party took control?)
- Simple method: Was the top line prediction “right”? (Yes, we said Democrats had an 80% chance to take control of the House)
- Better, but still simple: How close did we get the final seat tally (Predicted 227 seats for Dems, they will end up with ~234 seats), how many districts did we call “correctly” (422 of 435 district forecasts were “right”, which is about 97% accurate)
Most models for the House did well in the metrics above, so it is tough to differentiate them using such simple measures of accuracy.
Instead, we can look at the district level predictions.
- Pretty good method: Is the model properly tuned? Did it get about half of its predicted “toss-ups” correct, most of the “leans” correct, and almost all of the “likelys” correct? (we got 45% of toss-ups correct, 85% of leans, 95% of likelys).
- Best method: Brier Score – measures the accuracy of probabilistic predictions (ranging from 0 to 1) to events that are mutually exclusive (only one candidate per district wins) and discrete (the only possible outcomes for each candidate are victory or defeat). Here’s how it works:
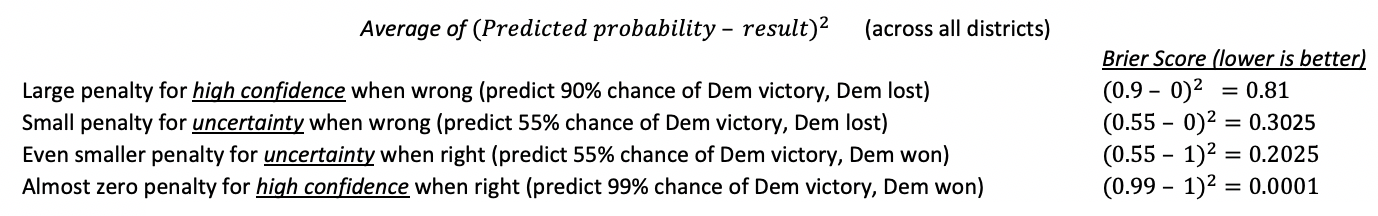
Bottom line: of all the House models out there in 2018, the two with the best Brier scores were CNN’s (0.025) and Fivethirtyeight’s Deluxe model (0.023)
Lessons Learned
What did the two highest performing (according to Brier scores) models have in common? They were the only ones to include the expert ratings as a variable.
This is a key point because it illustrates a bigger issue with predictive models. As we continue to see innovation in machine learning and predictive models that are often more accurate than human judgement (even by “experts”), there is a temptation to rely solely on these technologies, and that is often a mistake. I like this passage from Prediction Machines: The Simple Economics of Artificial Intelligence:
“Machines and humans have distinct strengths and weaknesses in the
context of prediction. As prediction machines improve, businesses must
adjust their division of labor between humans and machines in response.
Prediction machines are better than humans at factoring in complex
interactions among different indicators, especially in settings with rich
data. As the number of dimensions for such interactions grows, the ability
of humans to form accurate predictions diminishes, especially relative to
machines. However, humans are often better than machines when
understanding the data generation process confers a prediction advantage,
especially in settings with thin data. We describe a taxonomy of prediction
settings (i.e., known knowns, known unknowns, unknown knowns, and
unknown unknowns) that is useful for anticipating the appropriate division
of labor.”
We see this in many areas of business and social life. Take chess as an example — ever since Garry Kasparov lost to IBM’s Deep Blue computer in 1996, most people regard these computers as the best chess players in the world. But even in chess, a team of human grandmasters and a chess-playing computer working together are better than the computer alone. This is true in many fields, and is well-documented by Philip Tetlock in his book “Superforecasters”, which I highly recommend.
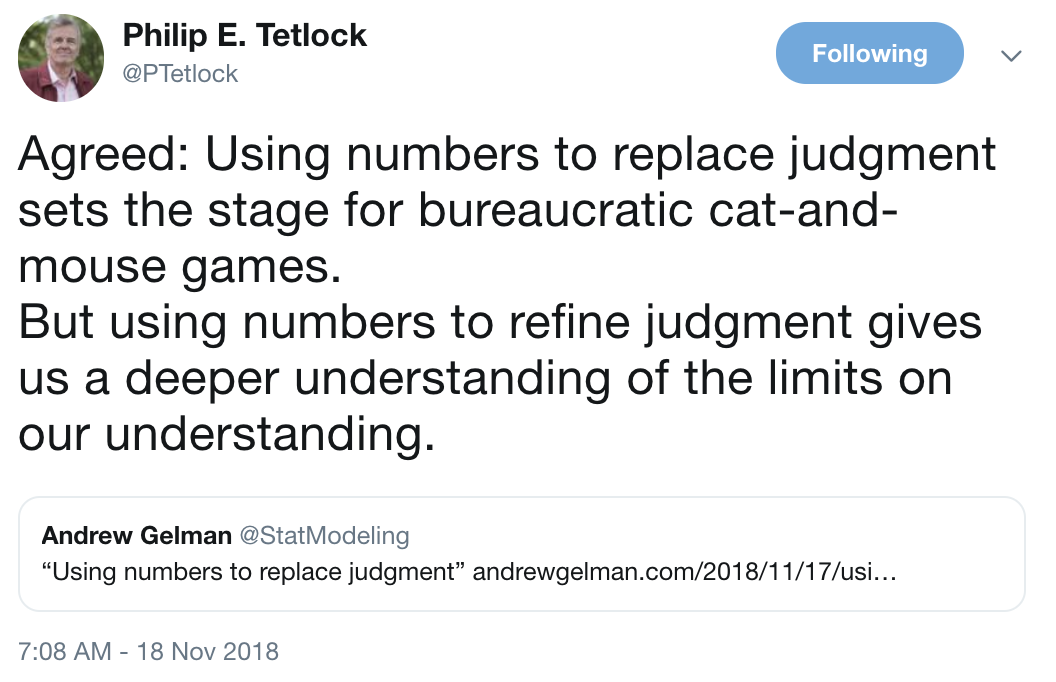
I think that many business operations would benefit from explicitly including qualitative expert analysis into their models, and testing their predictive power, just like we did with our midterm forecast. I think this is especially true for large, bureaucratic organizations that have a lot of subject-matter-experts embedded into their operations (I say this as an Air Force data analyst). I will let Tetlock have the last word on this:
Final Thoughts
Working with Harry Enten and Sam Petulla at CNN was quite the experience. It was very different from my work at Air Mobility Command, and our incredibly short timeline caused a fair amount of stress on all of us. But it was also a blast, and I loved seeing my work shared with a large audience and navigating the ups and downs of election season.
One major challenge for us was testing that our assumptions and sources of error were backed by historical results and research. This is a very important part of modeling, especially in a field like election studies, and we simply didn’t have enough time to do it as well as we hoped.
I also learned how important it is to know your audience — I had an idea of how I wanted to present the methodology and predictions, but Harry, knowing the challenges of communicating these complex topics, steered us in the right direction. For example, you might have noticed that while our model produced probabilistic predictions, we only displayed margins on our site because they are easier to communicate to a wide audience.
I hope and plan to work with CNN again in future elections, so make sure you keep an eye out, and thanks to all those who enjoyed our product!